3D Silo Inventory Tracking in a Bangladesh Feed Mill
Rettar's 3D radar scanner offers 3D surface mapping and volumetric inventory tracking across multiple feed mill storage silos.
Feed mills handling corn, wheat, and soybean meal need reliable inventory data across multiple storage silos. These materials behave differently during storage. Grain can form uneven surfaces during filling and discharge, while soybean meal may stick to silo walls and accumulate over time. In a Bangladesh feed mill application, Rettar's 3DPro2300 Radar Scanner provides 3D surface mapping and volume data for silo inventory tracking, giving operators a clearer view of stored material across multiple silos.
Monitoring Corn and Soybean Meal Across Multiple Silos
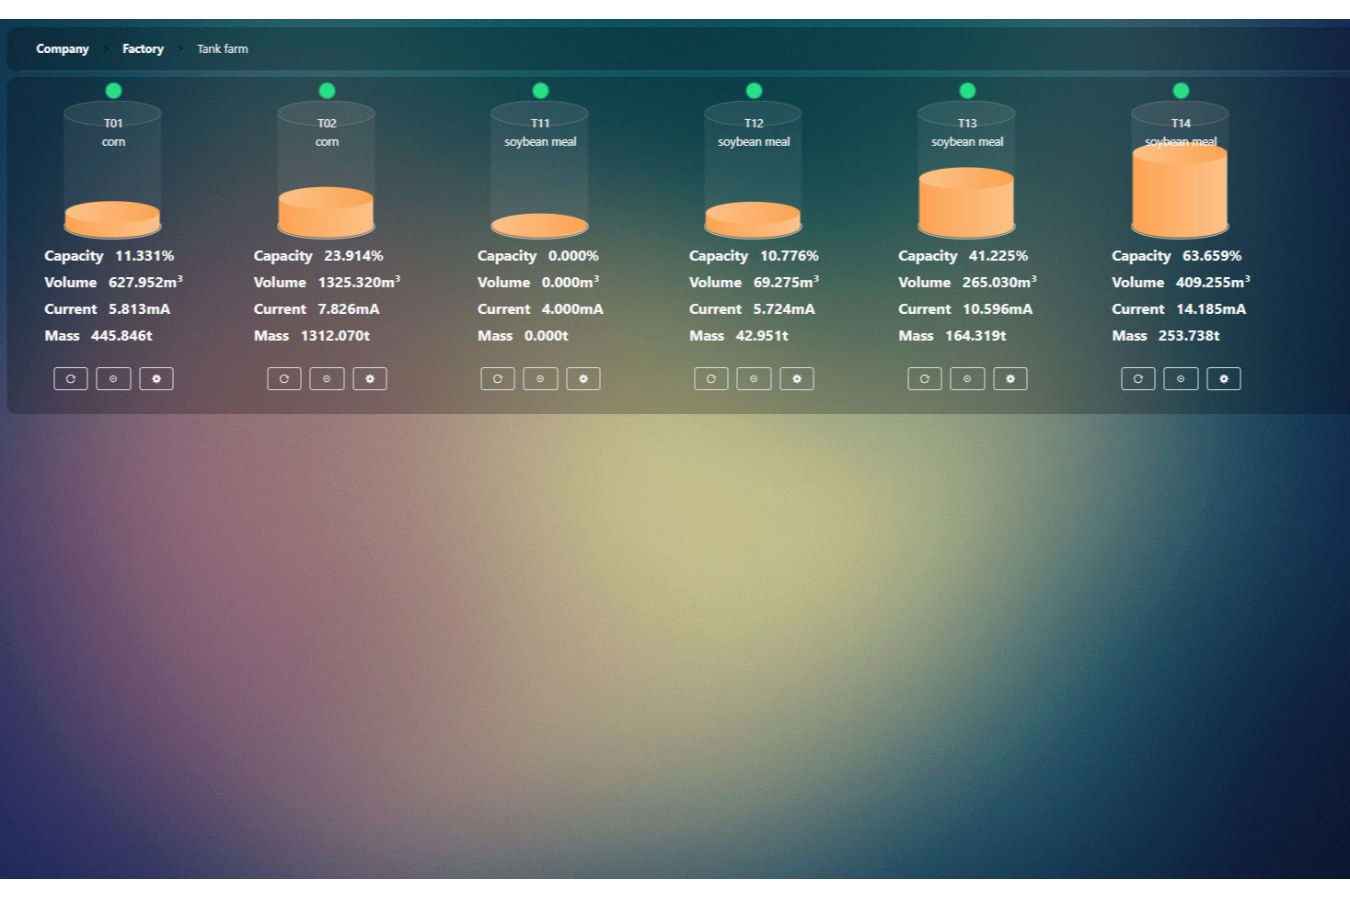
The feed mill uses separate silos for different raw materials. The supplied monitoring dashboard shows corn stored in silos T01 and T02, and soybean meal stored in T11, T12, T13, and T14.
The system displays inventory information for each silo, including volume, mass, capacity percentage, and current measurement readings. This allows operators to check several storage locations from one interface rather than reviewing each silo separately.
For example, the dashboard records 627.952 m³ of corn in silo T01, with an estimated mass of 445.846 tonnes. Silo T02 contains 1,325.320 m³, corresponding to 1,312.070 tonnes.
The soybean meal silos show different inventory levels. T12 records 69.275 m³ and 42.951 tonnes, while T13 records 265.030 m³ and 164.319 tonnes. T14 contains 409.255 m³, with an estimated mass of 253.738 tonnes. T11 displays zero volume and mass in the captured dashboard.
These readings give warehouse and production teams a direct overview of inventory distribution across the storage area.
3D Radar Scanning at 80 GHz for Silo Volume Measurement
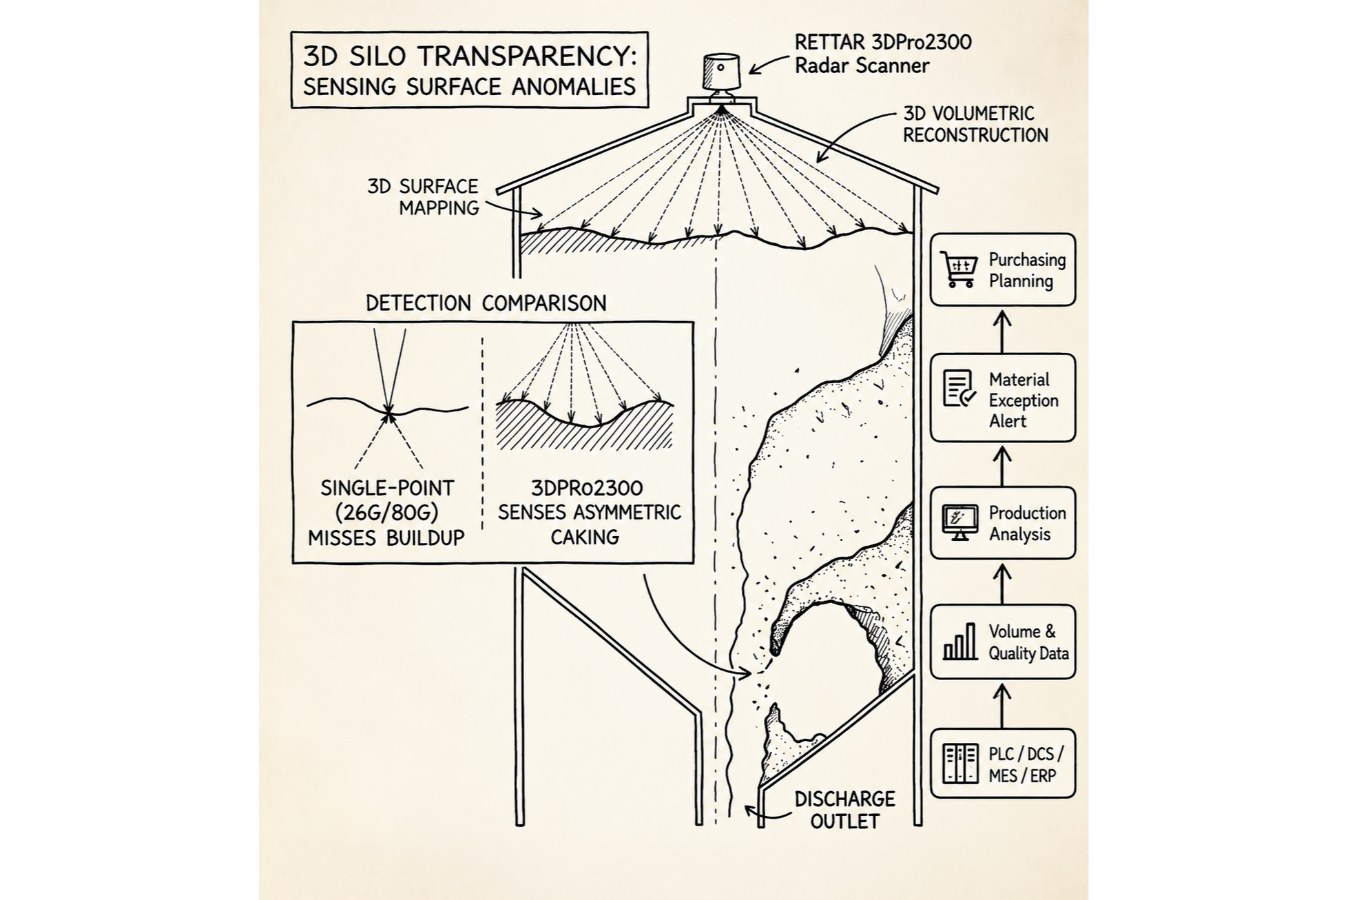
The Rettar 3DPro2300 Radar Scanner uses 80 GHz FMCW radar technology to collect distance measurements across the silo. Instead of relying on a single measurement point, it scans multiple positions on the material surface.
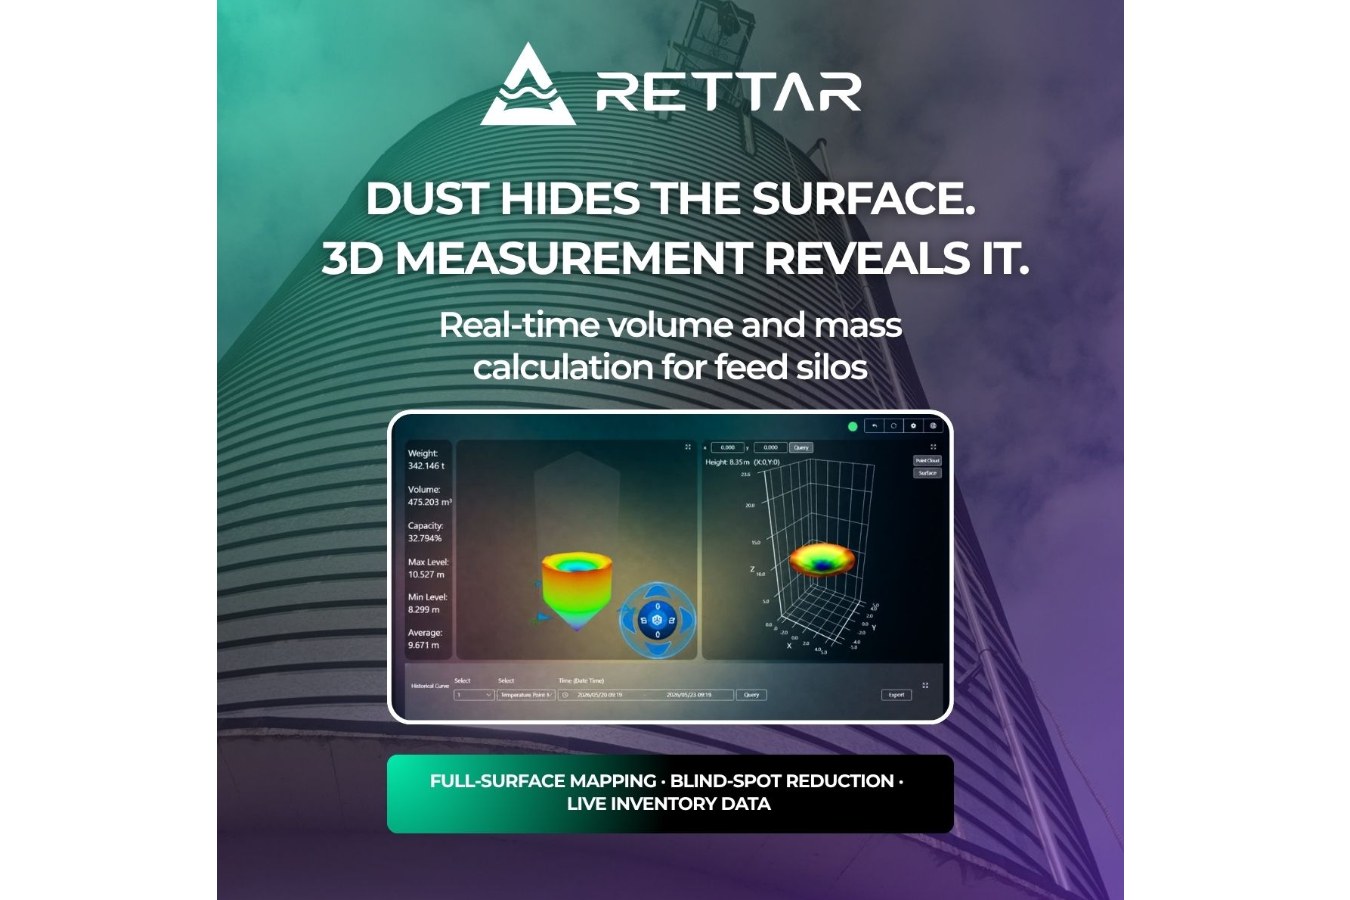
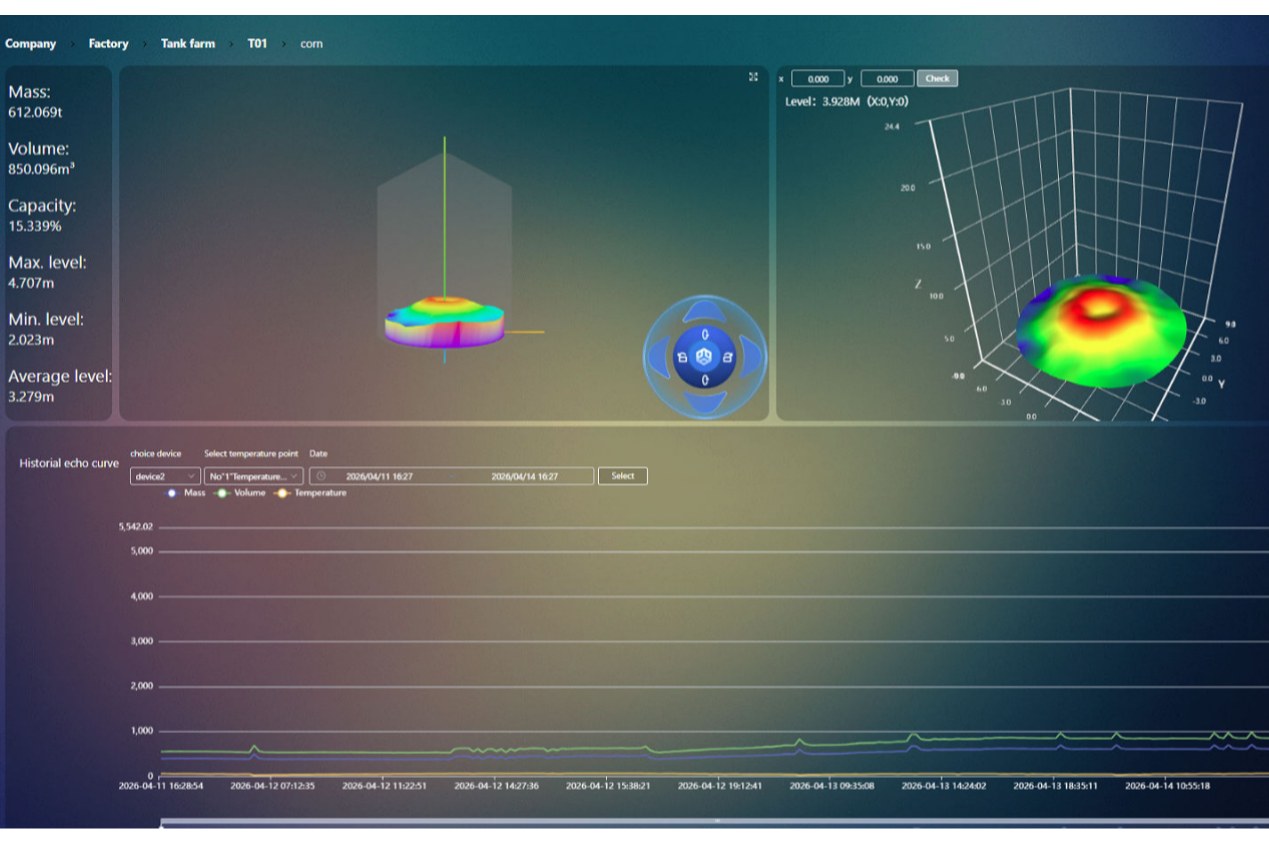
The collected data is used for 3D Surface Mapping and 3D Volumetric Reconstruction. The resulting model shows the measured surface profile and provides the basis for calculating stored volume.
A detailed silo interface also displays maximum, minimum, and average material levels. In one T01 monitoring view, the recorded volume is 850.096 m³ and the estimated mass is 612.069 tonnes. The same screen displays a maximum level of 4.707 m, a minimum level of 2.023 m, and an average level of 3.279 m.
These parameters provide more information than a single-point reading. They help operators review material distribution and understand changes in the measured surface over time.
From Volume Measurement to Bulk Inventory Data
Volume measurement is an important part of inventory control, but feed mills also need to know the estimated mass of stored raw materials.
The system uses measured volume together with the configured bulk density to calculate mass. Different materials require their own density settings. Actual mass estimates depend on the accuracy of these settings and changes in material properties.
This is particularly relevant when corn and soybean meal are stored in the same facility. Their bulk densities differ, so a suitable material-specific configuration is needed for meaningful inventory calculations.
With volume and estimated mass available for each silo, inventory tracking becomes easier to coordinate across multiple storage locations.
Connecting Silo Transparency with Data Transparency
3D scanning provides information about the material surface inside each silo. When volume and mass data are connected to plant management systems, this information can also support decisions beyond the storage area.
Warehouse teams can review current stock levels. Production teams can compare inventory changes with material consumption. Purchasing teams can use the available stock data when planning raw material replenishment.
If measured inventory changes do not match expected filling or discharge activity, the difference can prompt further checks. Operators can review the 3D surface model alongside process records and site observations to investigate possible material buildup or unusual flow conditions.
This connects Silo Transparency with Data Transparency. The first shows the measured material condition inside the silo. The second makes inventory information available to the teams responsible for storage, production, and purchasing. This data flow also supports the development of Industry 4.0 practices in feed mill operations.
Explore Silo Measurement Systems for Feed Mills
Reliable inventory decisions start with a clear view of stored material. Explore Rettar's Silo Measurement Systems to see how 3D radar scanning can support multi-silo monitoring, volume measurement, and inventory data integration in feed mills.